


Mice kidneys harbor a unique microbial signature
Given pragmatic issues in establishing and assessing a kidney microbiota in humans, comprehensive assessment of the kidney microbiota was initially examined in mice. To quantify viable bacterial loads in mouse kidneys, aseptically retrieved punch biopsies of three, 10-week-old SWR/J mice housed in a clean barrier facility were plated undiluted in seven different media, incubated, and colony-forming units (CFUs) quantified. Data revealed a significant increase in bacterial density from the renal cortex to medulla, then ureter (Fig. 1a,b; Paired chi-square x2 = 5.024, p = 0.023 (a) or t-test cortex:medulla- t = 3.96; p = 0.0036; cortex:ureter- t = 6.47; p = 0.00002; ureter:medulla- t = 2.17; p = 0.09 (b)). Negative controls did not produce CFUs. An RNA-targeted, fluorescence in situ hybridization (FISH) analysis of kidneys stained with a universal probe for bacteria shows the presence bacteria in the medulla and cortex (Fig. 1c) and is consistent with the distribution of bacteria assessed by culture-based means.

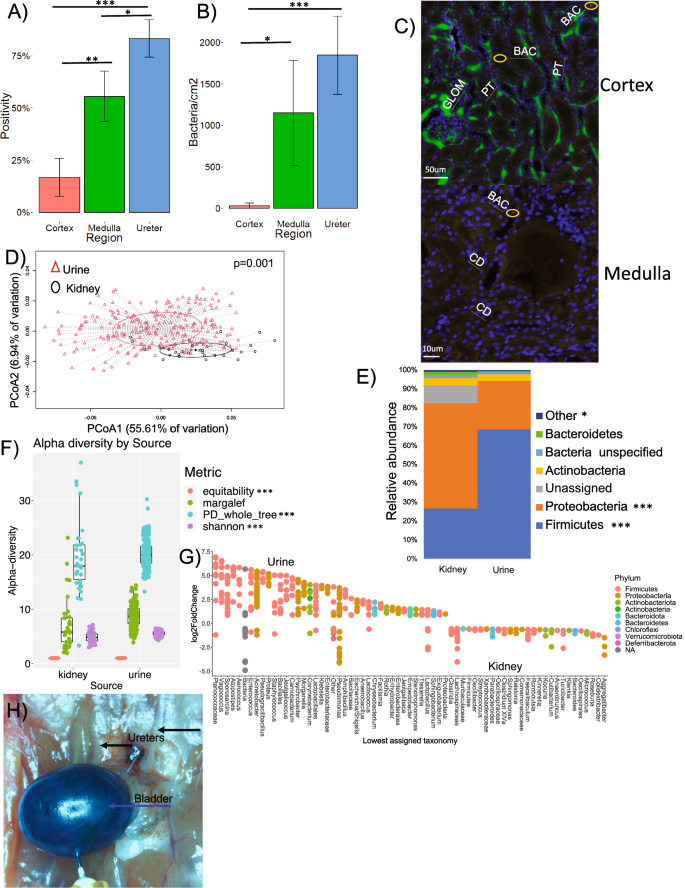
A Proportion of positive regions in kidney biopsies (undiluted) exhibiting at least one bacterial colony after inoculation of kidney tissue on six different culture media. N = 18/segment. Paired, Holm’s corrected, paired chi-square tests; cortex:medulla-df=53; X2 = 5.024; p = 0.023; medulla:ureter; X2 = 5.024; p = 0.026; ureter:cortex; X2 = 10.234; p = 0.00004. B Microbial density in kidney biopsy by regions (bacterial cells/cm2), from six different culture media. N = 18/segment. Paired, Holm’s corrected, paired t-tests; cortex:medulla-df=53; t = 3.96; p = 0.0036; cortex:ureter-df=53; t = 6.47; p = 0.00002; ureter:medulla -df=53 t = 2.17; p = 0.09. C Hybridization of FISH bacterial probe in both the cortex and medulla showing proximal tubules (PT), glomeruli (GLOM), DAPI-stained nuclei (blue color), and bacteria stained with the universal, EUB probe (BAC, red dot within yellow circle). Green fluorescence is auto-flourescence. Representative image was repeated for 5 animals in the LT_abx group and 5 in the LT_noabx group. All data generated from these images is presented in Fig. 3C. D–G Comparison of bacterial diversity using 16S rRNA V4 region sequencing from animals of all the experimental groups independent of intervention. D Principle component analysis (PCoA of weighted UniFrac distance between kidney and urine samples. Statistical analysis was conducted as a PERMANOVA with 999 permutations (N = 34 kidneys, 267 urine; df=300; f = 97; p = 0.001). E Comparative phylum profile between kidney and urine samples. Statistical comparison is provided by a false discovery corrected, DESeq2 differential abundance at the phylum level. Statistical analysis was a DESeq2 differential abundance (N = 34 kidneys, 267 urine; FDR < 0.05 for phyla with *) F Alpha diversity of normalized samples using different metrics. Statistical significance is provided by Holm’s-corrected, paired t-tests (N = 34 kidneys, 267 urine; df = 300; PD_whole_tree t = 3.24, p = 0.19; Margalef t = 914, p = 0.0009; Shannon t = 2.7 × 10¹¹, p = 6.9 × 10⁻¹²; equitability t = 4.5 × 10¹⁷, p = 5.6 × 10⁻¹⁸. G Differential abundance of taxa between kidney and urine. Statistical significance is provided by false discovery corrected, DESeq2 differential abundance at the ASV level. Taxa are listed to lowest assigned taxonomy. All listed taxa have FDR < 0.05. Positive log2foldchange represents ASV’s enriched in urine, negative values are ASV’s enriched in kidneys. The full set of significantly different ASVs is provided in Supplementary data 1. H Blue arrow shows the bladder, filled with methylene blue at 150 cm3 of pressure. Black arrows show the ureters with no blue dye. *p-value < 0.05, **p-value < 0.01, ***p-value < 0.001. For box and whisker plots; the center is the data mean, minima and maxima are the 25th and 75th percentiles; whiskers extend 1.5 interquartile range from minima and maxima. Source data are provided as a Source Data file.
To evaluate the presence of a kidney microbiota using criteria established for low biomass microbial communities19 and quantify the impact of antibiotics on kidney bacteria, one-hundred sixty SWR/J mice were exposed to antibiotics, with or without recovery, in parallel with non-exposed controls (Fig. 1). Animals exhibited an antibiotic-dependent difference in water intake and urine output similar to past studies20, but not food intake or body mass (Two-way ANOVA and post-hoc, Holm’s corrected, paired t-tests; t = 16.436, p < 0.001 for water, t = 10.23 p = 0.001 for urine; Fig. 2). A total of 239 urine samples and 40 kidneys were subjected to high-throughput sequencing of the V4 region of the 16S rRNA gene. There was an average of 8336 + /- 598 reads per sample, with 2821 + /- 62 mapping to host reads. Kidney and urine samples were significantly different than positive and negative controls in terms of microbial community composition (Permanova f = 3.98, p = 0.001; Fig. 3a). All kidney and urine samples surpassed the sequencing threshold to provide a statistically representative snapshot of microbial communities based on rarefaction analysis, defined as the sequencing depth that >90% of samples had a slope of <0.01 (Fig. 3b). While 5.34% of high-quality reads were removed from urine samples as Eukaryotic/host, 52% of reads were removed from kidney specimens as Eukaryotic/host (ANOVA, f = 5.73, p < 0.001; Fig. 3c).
PERMANOVA analysis, based on weighted UniFrac dissimilarity, revealed that the murine kidneys and urine microbiomes were unique (f = 97, p = 0.001; Fig. 1d). Taxa in kidneys and urine were dominated by the Pseudomonadota and Bacilliota, with relatively high numbers of Actinobacteriota and low levels of Bacteroidota (DESeq2; FDR < 0.05 for significantly different phyla; Fig. 1e), consistent with voided human urine7,9,21,22 and in contrast to predominant taxa in murine stool23. We detected significantly higher species richness/evenness in urine compared to kidneys (paired t-test; PD_whole_tree t = 3.24, p = 0.19; Margalef t = 914, p = 0.0009; Shannon t = 2.7 × 10¹¹, p = 6.9 × 10⁻¹²; equitability t = 4.5 × 10¹⁷, p = 5.6 × 10⁻¹⁸; Fig. 1f). Acinetobacter, a common urobiome taxon22, was most enriched in urine compared to kidneys (DESeq2; FDR < 0.05 for significantly different taxa; Fig. 1g, Supplementary data S1). Pseudomonas was most enriched in kidneys, compared to urine (Fig. 1g), a taxon that is resident in other organs, such as lung tissue24.
Importantly, vesicoureteral reflux (VUR) assays25 were conducted in 12-weeks male SWR/J to assess this renal defect phenotype in this breed used for the experiment. (Fig. 1h). Five animals were tested under the protocol described in the methods, and not any reflux was recorded from 30 to 150 cm2, observing exit of dye through the urethra at the highest pressure.
Long-term use of cefazolin impacts the LUT of mice, with recovery
Long-term use of cefazolin had a significant impact on bacterial composition and richness of the urine, even with a recovery period (2-way Anova f = 12.6, p = 0.0007; Fig. 2a; 2-way Anova f = 8.5, p = 0.021; Fig. 2b; Permanova f = 3.94, p = 0.018; Fig. 2c). Short-term antibiotic exposure did not impact the composition or richness (2-way Anova f = 0.014, p = 0.909; Fig. 4a; 2-way Anova f = 4.064, p = 0.05; Fig. 4b; Permanova f = 0.98, p = 0.32; Fig. 4c).

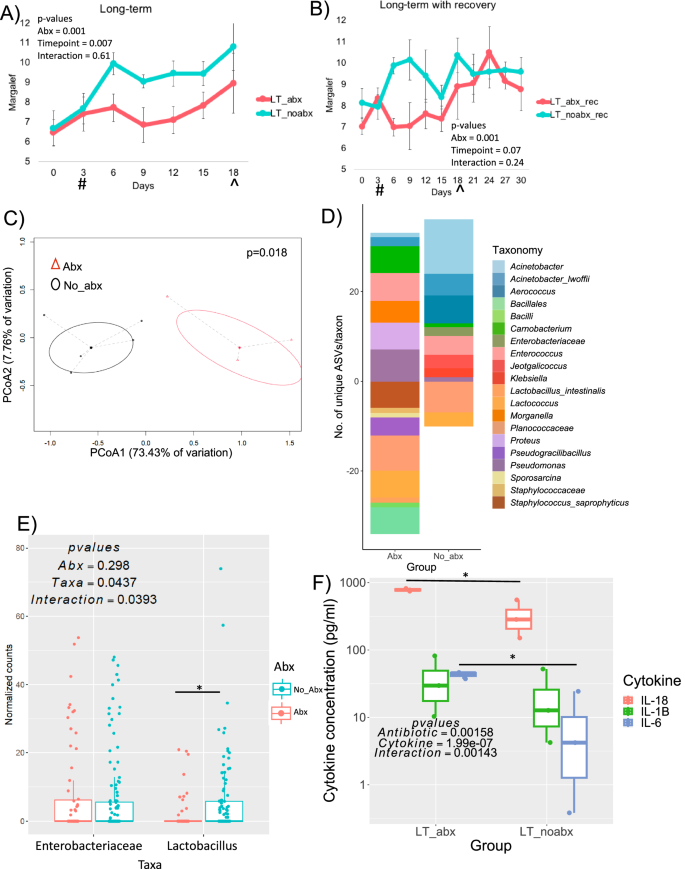
A Alpha diversity (Margalef’s species richness) over the course of the experiment for animals given cefazolin long-term and controls with no antibiotic treatment. Two-way ANOVA results are shown. Means are plotted +/- SEM. (N = 3-5 per group/timepoint; df=61; f = 12.6, 15.67, and 2,55 for group, timepoint, and interaction; p = 0.0007, 0.0002, and 0.11, respectively. B Alpha diversity over the course of the experiment for animals given cefazolin long-term and controls with no treatment, and with recovery following antibiotic cessation. Two-way ANOVA results are shown. Means are plotted +/- SEM. (N = 3-5 per group/timepoint; df=99; f = 8.5; p = 0.021. #Indicates when antibiotics started. ^Indicates the point at which antibiotics ceased. C PCoA of weighted UniFrac distance between the last timepoint for urine specimens with long-term antibiotic use (LT_abx) and controls without antibiotics (LT_noabx). Statistical comparison was conducted as a PERMANOVA with 999 permutations (N = 5/group; df=7, f = 3.94,p = 0.018). D Differential abundance taxa between the first and the last timepoints in urine specimens with or without antibiotic exposure. Negative values are the number of taxa lost over the course of the trial, while positive values are those that increased in abundance. Statistical significance is provided by false discovery corrected, DESEQ2 differential abundance at the ASV level. Taxa are listed to lowest assigned taxonomy. N = 5/group. Full set of significant results and statistics is provided in Supplementary data 2. E Impact of cefazolin on the abundance of Lactobacillus and Enterobacteriaceae, based on 16S rRNA sequencing of all animals. 2-way ANOVA results are shown (N = 132/group; df=342, f = 1.088, 2.097, and 4.281 for abx, taxa, and interaction; p = 0.29, 0.04, and 0.04, respectively. F Urinary cytokine concentrations (by ELISA) in response to long-term antibiotic use. Two-way ANOVA results are shown with post-hoc paired, Holm’s-corrected t-tests. (N = 3/group; df = 17, f = 16.49, 72.51, and 11.87 for abx, cytokine, and interaction; p = 0.0016, 1.99 × 10⁻⁷, and 0.001, respectively. *p-value < 0.05, **p-value < 0.01, ***p-value < 0.001 for post-hoc t-tests. # indicates start of antibiotics; ^ indicates antibiotic cessation. For box and whisker plots; the center is the data mean, minima and maxima are the 25th and 75th percentiles; whiskers extend 1.5 interquartile range from minima and maxima. Source data are provided as a Source Data file.
To identify taxa positively or negatively impacted by antibiotic treatment in urine samples, we conducted a differential abundance analysis of amplicon sequence variants (ASVs) in animals that received a long-term course of antibiotics from baseline to the last day of exposure, compared to non-exposed controls (DESeq2, FDR < 0.05 Fig. 2d, Supplementary data S2). Genera of known uropathogens Pseudomonas (8 ASV’s), Proteus (6 ASV’s), and Enterococcus (10 ASV’s) significantly increased in abundance with antibiotic use (p < 0.01), indicative of antibiotic resistance, whereas Planococcaceae (7 ASV’s), Bacilliales (32 ASV’s), Staphylococcus (6 ASV’s), and Lactococcus (9 ASV’s) were most negatively impacted by intervention (FDR < 0.05). With the exception of Staphylococcus, infections by these taxa are rare and instead may represent the commensal urinary flora. Acinetobacter (19 ASV’s) most benefitted from time in the trial without antibiotic use (FDR < 0.05).
Previous studies suggest that bacteria from the Enterobacteriaceae and Lactobacillus taxa, present in kidney stones and urine, are associated with pro- or anti-lithogenic influences, respectively, on kidney stone development7,9,15. As such, we sought to evaluate the susceptibility of these specific taxa to antibiotic disturbance, as the use of antimicrobials have been associated with the development of stones7,26. Proteus, a causative agent of UTIs and struvite stones27, is from the Enterobacteriaceae family and was one of the taxa that increased in abundance most after antibiotic use (6 ASV’s, FDR < 0.05), while Lactobacillus was significantly inhibited by antibiotics (Fig. 2d). Molecular and culture-based analysis of all Enterobacteriaceae and Lactobacillus at the endpoint for all groups, revealed that there was no impact of antibiotics on the Enterobacteriaceae, but a significant reduction of Lactobacillus (Two-way ANOVA f = 2.097, p = 0.04; Fig. 2e, f = 10.665, p = 0.013; Fig. 4d). Antibiotic-associated dysbiosis is consistent with published clinical urobiome data7,28,29 as well as antibiotic sensitivity testing across multiple Lactobacillus30 and Enterobacteriaceae31 species.
Proteomic techniques have revealed an upregulation of proinflammatory cytokines in the kidneys and urine of stone formers32. In our study, we observed a significant, antibiotic-associated increase in the urinary cytokines IL-1β and IL-6, but not IL-18 (Two-way ANOVA, f = 16.49, p = 0.002; Fig. 2f), which could reflect urinary dysbiosis-driven inflammation due to higher levels of Enterobacteriaceae33 or an oxalate-driven inflammatory response due to reduced oxalate degradation34,35.
Murine kidney microbiota is stable, but shifts towards uropathogenic bacteria with cefazolin exposure
To evaluate the stability of the murine renal microbiota, we quantified alpha diversity of the kidney microbiome longitudinally for animals not exposed to antibiotics, similar to previous analyses in low microbiome echosystems36. While antibiotic exposure did not significantly change the number of microbial species detected in the kidneys (paired t-test, t = 0.5, p = 0.6’ Fig. 3a), there was a shift in overall microbial composition based on weighted UniFrac dissimilarity (Permanova, f = 3.94, p = 0.03; Fig. 3b). In contrast, there was no impact of a short-term course of antibiotics for the kidney microbiome (Fig. 4e; one-way ANOVA, N = 4-6/group, df=9, f = 0.03 for Abx; p = 0.867; Fig. 4f; Permanova, N = 4-5/group; df=8, f = 1.153,p = 0.654). There were no significant changes in renal microbial alpha diversity over 30 days (Pearson’s correlation, r = 0.14, 0.45, 0.5, 0,42 and p = 0.6, 0.2, 0.16, 0.2 for equitability, Margalef, PD_whole_tree, and Shannon; Fig. 3c), indicative of a stable community37. Similar to the LUT, Acinetobacter, Lactobacillus and Lactococcus (1 ASV each) were lost in the kidneys with antibiotic treatment (DESeq2; FDR < 0.05). Tepidimonas and Lysinibacillus (1 ASV each) proliferated with antibiotic administration (Fig. 3d, Supplementary data S3; FDR < 0.05). There was no effect of a short-term course of antibiotics on species number or composition (paired t-test, t = 0.03, p = 0.867; Fig. 4e).

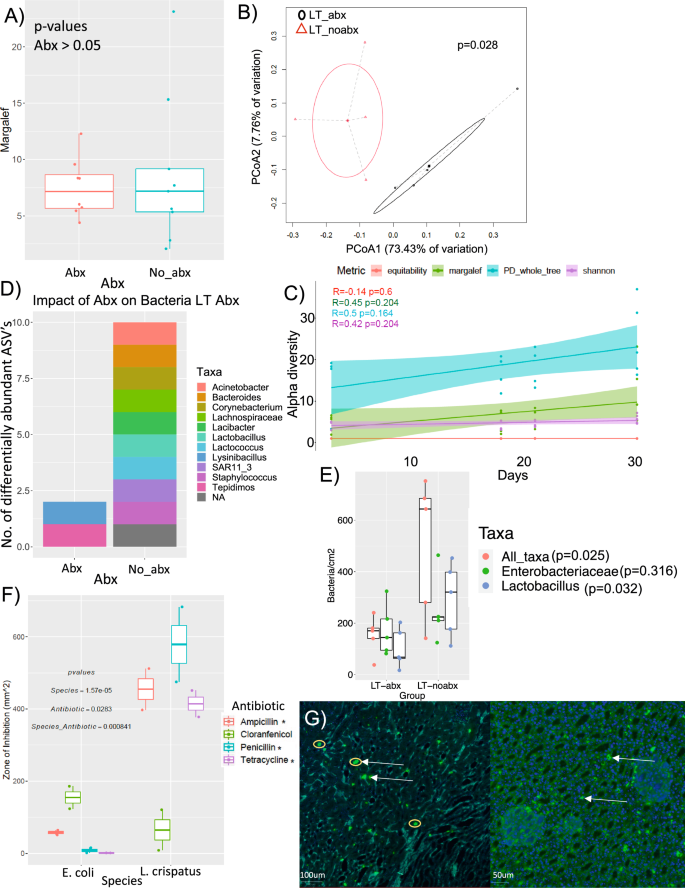
A Alpha diversity (Margalef’s species richness) of the kidney microbiota post-necropsy for animals given cefazolin long-term and controls with no antibiotics. P-value reflects a paired t-test (N = 8-9/group, df=16, t = 0.505, p = 0.6. B PCoA of weighted UniFrac distance between the last timepoint for kidney specimens with long-term antibiotic use (LT_abx) and controls without antibiotics (LT_noabx) (N = 3-5; df=6, f = 3.94, p = 0.028). Statistical analysis was conducted as a PERMANOVA with 999 permutations. C Alpha diversity of the kidney microbiota post-necropsy for animals not exposed to cefazolin, sampled at different time points, for multiple alpha diversity metrics. Statistical analysis is based on Pearson correlations between alpha diversity and time in animal study. (N = 17; df=6; r = -0.14, 0.45, 0.5, and 0.42 for equitability, margalef, PD_whole_tree, and Shannon; p = 0.6, 0.068, 0.041, and 0.09, respectively. D Differential abundance of taxa between kidneys from mice given cefazolin long term or controls with no antibiotics. Statistical significance is provided by false discovery corrected, DESeq2 differential abundance at the ASV level. Taxa are listed to lowest assigned taxonomy. N = 5/group, df=68. Full set of significant results and statistics is provided in Supplementary data 3. E Effect of a long-term course of antibiotics on all bacteria, Enterobacteriaceae, and Lactobacillus sp., based on direct counts of FISH-stained bacteria in the cortex and medulla of kidney sections. ANOVA results are shown with post-hoc paired, Holm’s-corrected t-tests. (N = 5/group; df=29; t = 12.69, 0.65, and 9.81 for all bacteria, Enterobacteriaceae, and Lactobacillus; p = 0.04, 0.316, 0.04, respectively. F Validation of differential antibiotic susceptibility of Lactobacillus sp. and Enterobacteriaceae with the use of susceptibility testing discs, using pure cultures of L. crispatus (ATCC 33197) and E. coli (ATCC 43886). Two-way ANOVA results are shown with post-hoc paired, Holm’s-corrected t-tests. (N = 2/species, antibiotic due to low variance and strong effect sizes; t = 15.5, 0.74, 10, and 41 for Ampicillin, Choranfenicol, Penicillin, and Tetracycline, p = 0.04, 0.3, 0.04, 0.028, respectively. G FISH-based imaging of an outbreak of Enterobacteriaceae. White arrows indicate fluorescently labeled Enterobacteriaceae. Yellow circles highlight clusters of individually discernable bacteria. Left image is the outer medulla, populated largely be distal tubules and the right image is the cortex, populated largely by proximal tubules. Representative image was repeated for 5 animals in the LT_abx group and 5 in the LT_noabx group. All data generated from these images is presented in Fig. 3C. *p-value < 0.05, **p-value < 0.01, ***p-value < 0.001 for post-hoc t-tests. For box and whisker plots; the center is the data mean, minima and maxima are the 25th and 75th percentiles; whiskers extend 1.5 interquartile range from minima and maxima. Source data are provided as a Source Data file.
To validate molecular data, an RNA-FISH protocol was utilized to localize and quantify microbial DNA through hybridization in mouse kidney tissue. Three targeting probes were used for all bacteria, Enterobacteriaceae, or Lactobacillus. The protocol was validated with pure cultures from either the Enterobacteriaceae or Lactobacillus taxa, isolated from mouse urine (Fig. 5a–c). The EUB (universal), PB (Enterobacteriaceae) and GC (Lactobacillus) probes hybridized to the intended targets of all bacteria, Enterobacteriaceae, and Lactobacillus. There was co-localization with DAPI signals with all probes, and no cross hybridization observed in triplicate samples. Kidney slides stained with DAPI and any one of the three probes exhibited bacterial signals primarily located in the medulla, in or around the renal tubules and collecting ducts (Fig. 5d–f). Negative controls, which included stained slides without tissue or bacteria (Fig. 5g) did not exhibit any bacterial signals. Additionally, serial sections of mice kidney samples stained with randomly scramble probe sequences did not exhibit fluorescent signals, compared to their counterpart sections from the same samples stained with bacterial targeting probes (Fig. 5h–j). Quantitative analysis of bacteria was independently performed by two analysts blinded to sample identifiers. Analysis of surroundings and borders of kidney tissue did not show the presence of randomly distributed bacteria, suggesting no contamination during slide processing38. Histologic analysis revealed no indications of calcium oxalate deposition or kidney injury. Quantitative results show a significant loss of total microbial density in the kidneys with antibiotics (paired t-tests, t = 12.69 p = 0.04), with a clear impact on Lactobacillus (t = 9.81, p = 0.04), but not on Enterobacteriaceae (t = 0.04, p = 0.316; Fig. 3e), consistent with molecular (Figs. 2e, 3d) and culture-based (Fig. 4d) analyses in urine. These findings suggest a shift in kidney microbial communities caused by antibiotics towards antibiotic-resistant, uropathogenic Enterobacteriaceae and away from uroprotective bacteria such as Lactobacillus. Validation of results were obtained through antibiotic resistance assays on a kidney stone-associated strain of E. coli (ATCC 43886)7,13 and a strain of L. crispatus that is negatively associated with urinary stone disease7,8,9,39, such that L. crispatus was significantly more susceptible to three out of four antibiotics tested compared to E. coli (Fig. 3f; p = 0.02). Genomic analysis revealed that the genome of E. coli (ATCC 43886) harbors more antibiotic resistance genes than L. crispatus (Fig. 6a).
Occasional outbreaks of Enterobacteriaceae hybridization in the kidneys were apparent and clusters were often observed (Fig. 3g). These observations were consistent with molecular data which saw three of the 10 mice exhibiting very high Enterobacteriaceae counts compared to the other animals (Fig. 6b), which may result from virulence factors, as suggested by the higher number of genes for biofilm formation, stress response, and competition than L. crispatus (Fig. 6a). Molecular comparison of Enterobacteriaceae and Lactobacillus in the kidneys, reveals that either one or the other taxa was dominant, indicative of potential direct competition (Fig. 6c).
Specific strains of Lactobacillus and E. coli compete and differentially impact calcium oxalate crystal metrics through known non-canonical pathways
To determine the direct impact of candidate bacteria on the growth of calcified crystals, we utilized a CDC bioreactor system, which is a specialized chemostat that mimics the constant flow, shear forces, temperature, and biochemical environment of the kidneys, while providing a removable surface for biofilm growth40. Uroprotective L. crispatus and stone-associated strain of E. coli (ATCC 43886) were incubated in the bioreactor individually and in co-culture to evaluate their influence on CaOx crystallization.
Artificial urine media (AUM; Supplementary data S4) was run at a constant flow into the chemostat system, which was placed on a stir plate at 37 °C and at a constant stir rate. The system was either run sterile or inoculated with candidate bacteria at equal starting densities. After 72hrs, removable polycarbonate coupons were analyzed with scanning electron microscopy (SEM) and energy dispersive x-ray spectroscopy (EDS). Aliquots of media from each experiment were used to quantify bacterial density and viability. No culturable bacteria were recovered from sterile controls. For SEM and EDS, a pure, clinically extracted CaOx stone was included for crystal morphology analysis, along with in vitro CaOx crystals for validation of bioreactor studies.
In qRT-PCR analysis, when grown alone, 100% of sequences were attributed to E. coli or L. crispatus, relative to a universal bacterial primer (paired t-test against L. crispatus, t = 7.173, 8.459 and p = 0.0003, 0.0002 for co-cultures and E. coli; Fig. 7a; paired t-test against L. crispatus, t = 8.54, 9.76 and p = 0.0009, 0.0005 for co-cultures and E. coli; Fig. 7b). When co-cultured, E. coli (ATCC 43886) comprised ~90% of the culture after three days, despite equal inoculation densities (Fig. S7a, b). No detectable DNA was recovered with qRT-PCR from sterile controls. The E. coli strain (ATCC 43886) exhibited significantly higher viability compared to L. crispatus, in pure culture. However, the proportion of viable bacteria was significantly reduced in co-culture (ANOVA, f = 52.81, p = 0.0002; Fig. 7c). The more effective competitiveness by E. coli (ATCC 43886) was also reflected in the number of genes for competition in genome analyses (Fig. 6a).
The CaOx crystals were styloid laminated sheets in a clinical pure CaOx stone (Fig. 4a), consistent with CaOx monohydrate41, which is generally found on the surface of CaOx stones. In sterile media, crystals exhibited an octahedral structure, consistent with CaOx dihydrate crystals (Fig. 4b)42. Additionally, spherical structures less than 1μm in diameter were common, which appeared to aggregate into amorphous, then octahedral structures (Fig. 4b), consistent with a recently reported, non-canonical pathway for CaOx crystallization and growth43. To confirm abiotic origins of these nanospheres, we filter sterilized fresh AUM and observed media under light microscopy after one hour. Imaging showed a few shapes compatible with CaOx dihydrate crystals, but also showed many of the styloid crystal shapes and nano-sized spheres that were the same size and shape as those observed in SEM analysis (Fig. 7d). No culturable bacteria were recovered from this media, similar to sterile bioreactor runs. When stone-associated strain of E. coli (ATCC 43886) was grown by itself, octahedral structures were abundant along with nanospheres that appeared to aggregate to octahedral crystals (Fig. 4c). Bacteria were often found attached to octahedral structures. In contrast, when L. crispatus was grown alone, only small, amorphous crystal structures formed, with no bacterial attachment (Fig. 4d). When E. coli (ATCC 43886) and L. crispatus were co-cultured, styloid, CaOx monohydrate crystal structures were observed (Fig. 4e), indicative of an entirely different microbe-crystal interaction. Quantification of crystal size in bioreactor studies showed E. coli (ATCC 43886) grown alone produced the largest crystals, followed by sterile media, then L. crispatus grown alone (ANOVA, f = 52.54, p < 0.001; Fig. 4f). However, the influence on crystallization, based on plate-based crystal size assays, of other ATCC purchased species of lactic-acid bacteria and different strains of E. coli isolated from calcium-based stones was different from the findings observed with the bioreactor experiments. (ANOVA, f = 78.97, p < 0.001; Fig. 4g). Collectively, data suggest that this strain of E. coli (ATCC 43886) facilitates the growth and aggregation of CaOx crystals into larger and more complex octahedral structures through a non-canonical pathway, whereby CaOx nanospheres aggregate into amorphous structures and continue aggregating until the octahedral structures develop and further aggregate44. In contrast, L. crispatus appears to inhibit this process at the amorphous phase.

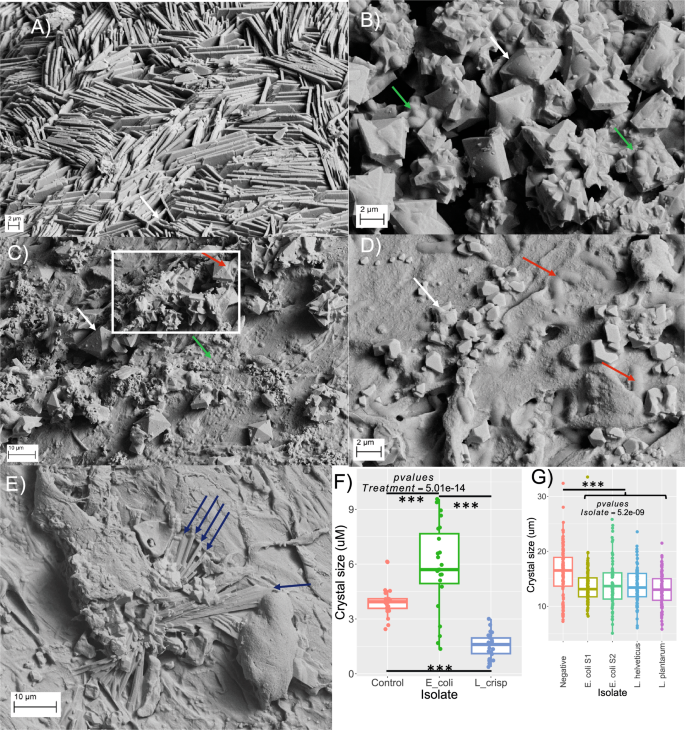
A Surgically removed CaOx kidney stone exhibiting laminated sheets of mineralized CaOx. B CaOx crystals formed in the absence of bacteria, through non-canonical processes whereby nano-sized CaOx spheres (green arrows) aggregate to amorphous forms and eventually to the classical octahedral, dihydrate structure (white arrows). C CaOx crystals formed in the presence of E. coli, through non-canonical pathways. Bacteria (red arrows) were seen growing on CaOx crystals. White box encloses a large CaOx crystal aggregate. D CaOx crystals formed in the presence of L. crispatus. Crystals that formed (white arrows) were either arrested at the amorphous phase or were broken down by microbial processes. Bacteria (red arrows) did not grow on crystals. E CaOx crystals formed in the presence of both E. coli and L. crispatus. Crystalline structures (blue arrows) are indicative of CaOx monohydrate, indicative of a shift in chemistry when bacteria were co-cultured. F, G Quantification of CaOx dihydrate crystal size in each microbial condition in bioreactor assays (F; N = 21-26/group; df = 67; control:E_coli –t = 4.09; p = 0.00012; control:L_crisp – t = 5.49; p = 1.3 × 10⁻⁶; E_coli:L_crisp – t = 9.95, p = 2.3 × 10⁻¹⁴) and plate-based assays (G; N = 78-135; df = 488; t = 3.87-6.18 for significant values; p = 1.3 × 10⁻⁸-0.00086 for significant values). ANOVA results are shown with post-hoc paired, Holm’s-corrected t-tests. ** p-value < 0.01; *** p-value < 0.001. For box and whisker plots; the center is the data mean, minima and maxima are the 25th and 75th percentiles; whiskers extend 1.5 interquartile range from minima and maxima. Source data are provided as a Source Data file.
The differential interaction between bacteria and CaOx crystallization could either be mediated through oxalate production/degradation, by the production of pro-/anti-lithogenic molecules, or by the interaction of proteins on the bacteria surface on crystal faces15. Genome analysis revealed that both species have an equal number of oxalate metabolism genes (Fig. 6a). A previous report showed that healthy individuals had a higher abundance of L. crispatus oxalate-degrading genes in their urine compared to CaOx stone formers9. In vitro oxalate-degrading assays revealed that L. crispatus was able to degrade significant amounts of oxalate, confirming genome and metagenomic analyses, but the stone-associate E. coli (ATCC 43886) produced significant amounts of oxalate (Two-way ANOVA, f = 23.47, p < 0.001; Fig. 7e).
Genome analysis revealed that E. coli (ATCC 43886) harbors more genes that overlap with known lithogenic factors, compared to L. crispatus, which includes genes for urea and metal interactions (Fig. 6a). In an energy dispersive x-ray spectroscopy (EDS)-based assay, peaks of calcium, carbon, and oxygen were observed in crystals formed by E. coli (ATCC 43886) and L. crispatus, consistent with CaOx crystals (Fig. 5a). The largest CaOx peaks were observed in the clinically extracted stone, along with the crystals from the sterile and E. coli (ATCC 43886) experiment. Other elements were present in lower abundance, such as sodium, chloride and nitrogen. Binomial dissimilarity matrix analysis of the whole elementome revealed treatment-specific effects with significant differences based on the presence or absence of bacteria (Permanova, f = 4.85, p = 0.001; Fig. 5b, ANOVA, f = 1.47-3.83, p = 0.004-0.206; Fig. 8a–h). Crystals that developed when L. crispatus was present were enriched in sulfur (Fig. 8f) and phosphorus (Fig. 8h), known calcium competitors linked to lower CaOx urolith formation44,45,46,47,48. In contrast, crystals formed when E. coli (ATCC 43886) was present were enriched in chloride (Fig. 8g) and iron (Fig. 8c), known promoters of CaOx crystals49,50,51.

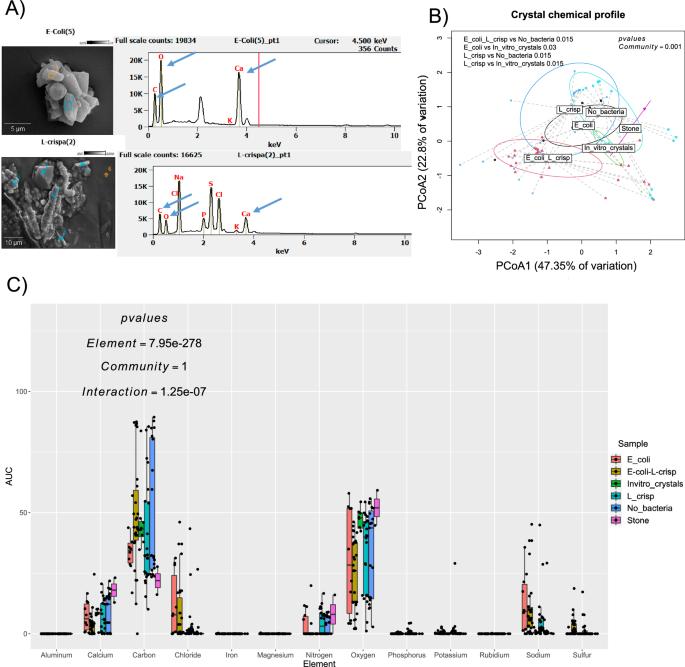
A Representative EDS chromatograms from E. coli (top) and L. crispatus (bottom), with peaks for CaOx highlighted (blue arrows). B PCoA representing the elemental analysis of CaOx crystals in each of the treatments. Statistical comparision was based on PERMANOVA (1-way global and 2-way, Holm’s corrected analyses) on the binomial distribution of elemental profiles (N = 10-30; for surgical stones N = 2; df=90; f = 4.8534; p = 0.001. C Comparison of the area under the curve for each element detected in crystals. Statistical analysis was a 2-way ANOVA (N = 10-30, except for kidney stones; df = 90 f = 0 for community, 17557 for element, and 2.319 for interaction; p = 1, 2 × 10-16, 1 × 10⁻⁷, respectively. Targeted analyses of all elements that show significant treatment effects are presented in Fig. 8. For box and whisker plots; the center is the data mean, minima and maxima are the 25th and 75th percentiles; whiskers extend 1.5 interquartile range from minima and maxima. Source data are provided as a Source Data file.
Metagenomic and FISH data from human renal specimens show microbial signature differentiated by tissue proximity, age, and ethnicity
To evaluate the presence of microbial signatures in human renal specimens, we conducted an RNA-FISH analysis of kidney biopsies and autopsies, using the universal bacterial probe (EUB). Image analysis revealed bacteria in all samples, typically reserved to lumen spaces (Fig. 6a-d). Bacterial density, estimated as the relative area of bacterial stain compared to total kidney tissue, was not significantly different between biopsies and autopsies, which suggests that bacterial proliferation post-mortem did not contribute to bacterial signals (paired t-test, t = 2.195, p = 0.177; Fig. 6e).

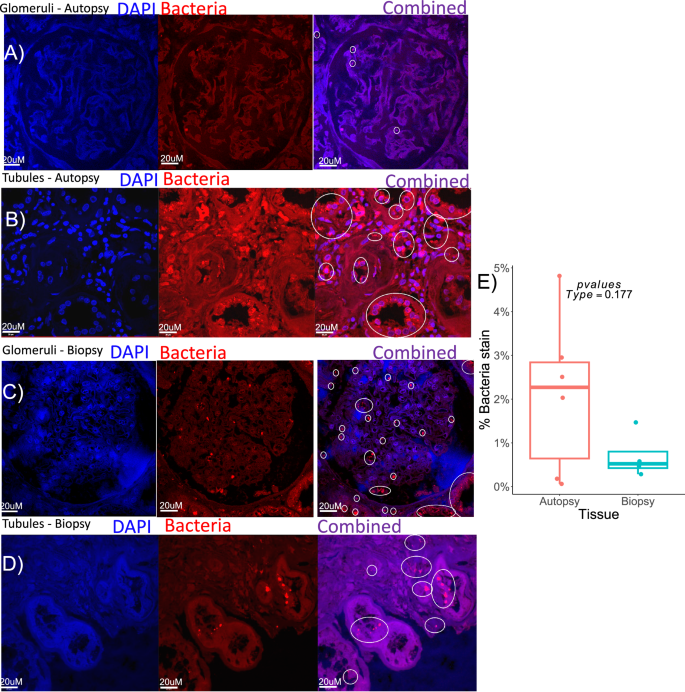
A universal bacterial FISH probe (red) with nuclear DNA detected with DAPI (blue) in kidney tissues obtained either in autopsy (A, B) or as biopsy (C, D). Bacteria was detected in glomeruli (A, C) and in the tubulointerstitium (B, D). For each image, the individual DAPI and bacteria channels are shown, along with the combined channel overlay. Bacterial signals indicated by fluorescent red, circled in white in the combined images. E Statistical comparison of the area of bacterial stain relative to total kidney tissue area between biopsies and autopsies. Statistical comparison was a t-test. Representative images were taken from N = 6 for autopsies and N = 4 for biopsies. df=9, t = 2.195, p = 0.177. All data is shown in Fig. 6E. For box and whisker plots; the center is the data mean, minima and maxima are the 25th and 75th percentiles; whiskers extend 1.5 interquartile range from minima and maxima. Source data are provided as a Source Data file.
To further evaluate the presence of bacteria in human kidneys, bacterial signatures in an independent population of kidney specimens were re-analyzed from a previously published transcriptomic dataset of micro-dissected glomeruli and tubuli that underwent polyA enrichment prior to sequencing (BioProject PRJNA725213)52. There were 101 sequenced samples from healthy participants available, which included 71 glomeruli and 30 tubuli. There was an average of 38,646,509 + /− 1,301,280 total reads/sample, with 19,086,347 + /− 639,898 mapping to host reads, and 56,191 + /− 2934 mapped to prokaryotes after removal of potential contaminants and low-quality reads. We observed significant differences in the ratio of high-quality sequences mapping to prokaryotes vs. human reads between glomeruli and tubuli (paired t-test, t = 26.99, p < 0.001; Fig. 9a). Importantly, nearly all reads exhibited 100% sequence homology with their microbial references, which minimizes the possibility of false microbial annotations (Fig. 9b). Wih this analysis, we observed significantly greater species richness in the glomeruli compared to tubuli (paired t-test, t = 25.37, p = 0.0007; Fig. 9c), with a posititve correlation with increasing age (Pearson’s correlation, r = 0.43, -0.14 and p = 0.0003, 0.45 for glomeruli and tubuli; Fig. 9d). The composition of the microbial signatures was significantly different between the glomeruli and tubuli, assessed with a Bray-Curtis dissimilarity index (Permanova, f = 28.58, p = 0.001; Fig. 9e). Bacterial phyla indentified in glomeruli and tubuli were dominated by Pseudomonadota and Bacilliota (Fig. 9f), consistent with previous urobiome studies7,21. Taxa that differentiated the glomeruli and tubuli, based on a DESeq2 analysis, were primarily Streptomyces (38 ASV’s), Pseudomonas (22 ASV’s), Burkholderia (16 ASV’s), and Streptococcus (15 ASV’s) in the glomeruli and Bacillus (17 ASV’s) in the tubuli (DESeq2, FDR < 0.05; Fig. 9g; Supplementary data S5). Similar results were obtained with an ANCOM analysis (ANCOMBC, FDR < 0.05; Fig. 9h). Ethnicity was a significant driver of composition and species richness in two-way analyses (Permanova, f = 2.85, p = 0.007; Fig. S9i; ANOVA, f = 6.191, p = 0.0007; Fig. 10a). We did not see differences in the kidney microbial signatures by gender identity (Two-way ANOVA f = 0.061, p = 0.805; Fig. 10b; Permanova f = 1.37, p = 0.253; Fig. 10c). Negative controls used in this analysis for decontamination were variable, but significantly different from positives, independent of source (Fig. 10d).
Scrutinization of microbiome data
To scrutinize and support the validity of the microbiome data generated from our analysis, we used a hybrid approach. First, we conducted statistical decontamination with Decontam, which removes 90% of contamination with minimal false negatives53 and we also conducted a knowledge-based removal of common taxa found in laboratory reagents54. Statistical decontamination led to a 23% reduction in the number of unique taxa in the human data compared to a 19% when bacteria was censored through a knowledge-based approach. In mouse data, statistical decontamination led to a 2.3% reduction in unique taxa compared to a 35% reduction with the knowledge-based approach. It must be noted, however, that in mouse studies, multiple sources of negatives that were directly tied to the experimental procedures were used as negatives for statistical decontamination. Additionally, many of the taxa that have been identified as reagent contaminants54 that we used for the knowledge-based scrutinization, such as Enterobacter, Escherichia, Corynebacterium, Kocuria, Bacillus, Streptococcus, and others, have been recurrently identified in the urinary tract microbiome55. As such, removal of these taxa would necessarily lead to a number of false negatives.
To assess the impact of decontamination methods on the statistical differences shown here, we compared the statistical significance in the beta diversity of human glomeruli vs. tubuli and mouse kidneys vs. urine. While the knowledge-based decontamination method led to a reduction in the statistical significance for both human and mouse data, beta diversity analyses were highly significant regardless of the decontamination method chosen (Fig. 11a, b). Additionally, to assess the impact of contamination on the statistical differences between groups, we simulated contamination in both the human and mouse data by using a random number generator to simulate universal, stochastically distributed taxa, similar to what would be seen with reagent-based contamination. In this analysis, we found that the number of contaminants exhibited a significant negative correlation with the beta diversity test statistic in both datasets (Pearson’s correlation, r = -1, p < 0.001; Fig. 11c, Pearson’s correlation, r = -96, p < 0.001; Fig. 11d).
link