

Study design
This study was designed as a prospective, case-control, single-center cross-sectional study. This study is a scientific research project that falls outside the scope of the “Regulation on Clinical Trials of Medicinal Products for Human Use” and is not considered a clinical trial. Therefore, the Clinical trial number is not applicable. The study was conducted by the Declaration of Helsinki and approved by the Harran University Clinical Research Ethics Committee (Approval Number: HRÜ/23.22.07 and Date of Approval: 27.11.2023). Informed consent (written) was obtained from all subjects and their legal guardians before their inclusion in the study.
Population and sample
The study population consisted of all consecutive children aged between one month and 18 years who were diagnosed with CAKUT at the Pediatric Nephrology and Radiology Departments at the Faculty of Medicine, Harran University, Sanliurfa, Turkey, between January 2023 and April 2024. CAKUT diagnosis included any primary anomaly of the kidney number, size, and/or morphology associated with additional malformations of the urinary tract, including unilateral kidney agenesis, multicystic dysplastic kidneys, kidney hypoplasia/dysplasia, horseshoe/ectopic pelvic kidney, ureteropelvic junction obstruction, vesicoureteral reflux, duplex collecting system, and posterior urethral valves [1, 2, 4]. Antenatal or postnatal ultrasound imaging and/or additional imaging studies, including voiding cystourethrograms, notably for VUR and magnetic resonance imaging, were used to diagnose the diseases associated with CAKUT. In cases with multiple anomalies, each diagnosis was categorized as an accompanying anomaly [1, 14].
All children in the study population were administered a renal cortical dimercaptosuccinic acid (DMSA) scan to assess renal scarring as focal or diffuse. Areas with reduced cortical technetium Tc 99 m DMSA uptake accompanied by focal or generalized contour abnormalities were deemed to indicate scar tissue [4, 15].
DMSA protocol
DMSA scans were performed following a standardized protocol, administering five mCi of Technetium-99 m-dimercaptosuccinic acid per 1.73 m² of body surface area, with a minimum dose of 1 mCi. At the same time, the patient was in a supine position. The dose of the nuclear agent was adjusted based on the child’s age and weight by the recommendations of the European Association of Nuclear Medicine. The effective radiation dose was less than 0.01 mSv [16]. To quantify the extent of renal scarring, each kidney was divided into 12 segments. High-resolution magnified images, including posterior and both right and left posterior oblique projections, were obtained 2–4 h post-injection using a γ-camera system with a high-resolution parallel collimator. Relative right-to-left renal function was calculated as the ratio of right-to-left kidney counts from the posterior views, corrected for background activity. The results were expressed quantitatively as the percentage uptake of the right kidney versus the left kidney.
Renal scarring was graded based on the number of injured segments: no injured segments (Grade 0), 1–2 injured segments (Grade 1), 3–4 injured segments (Grade 2), more than four injured segments (Grade 3), and global injury involving all segments (Grade 4) [17]. Children with Grades 1 to 4 were regarded as having abnormal DMSA findings [18].
Accordingly, children diagnosed with CAKUT but having a normal DMSA scan, those with acute glomerulonephritis within the last six months, or those with other chronic conditions such as glomerulonephritis, hypertensive nephropathy, diabetic nephropathy, gout, or urinary stones were excluded from the study. Children with incomplete data were also excluded. An active infection or a period of less than four weeks since any prior infection, except for acute glomerulonephritis, constituted exclusion criteria (Fig. 1).
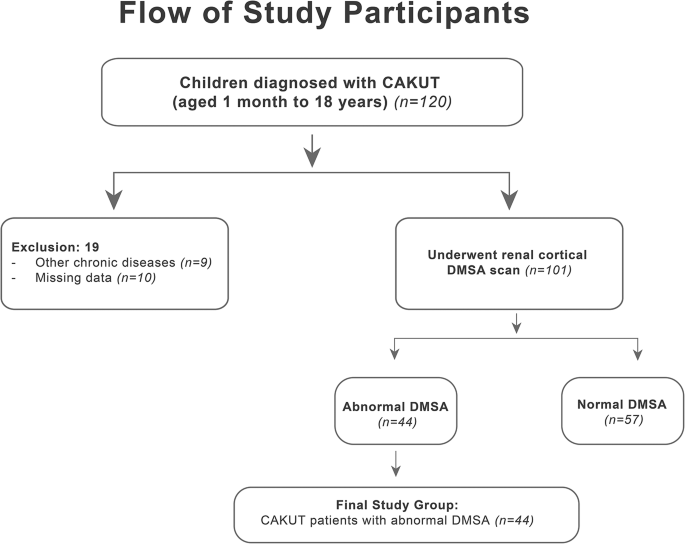
In the end, the patient group consisted of 44 children in whom the DMSA scan revealed renal scarring due to CAKUT. The control group consisted of 44 healthy children who were randomly selected from among the children on file at the Pediatric Nephrology Polyclinic, who had no acute or chronic diseases, especially those with normal blood pressure and renal functions, and who were matched with the patient group in terms of age and gender [10].
Data collection
Prospectively, children’s demographic (age and gender), anthropometric (weight and height), and clinical (associated genetic syndromes and anomalies and the details of CAKUT diseases) characteristics were collected. Their body mass index (BMI) values were calculated by dividing their weight (kg) by the square of their height (m²).
Laboratory tests performed on the children included measurements of blood urea nitrogen (BUN), creatinine, HIF-1α, and NRF2 levels. During the infection-free period, a 3–4 mL venous blood and a single-point urine sample were taken from each child in the morning upon admission to the outpatient clinic.
Serum samples were centrifuged at 2000 rpm for 20 min within 30 min of blood collection. The supernatant was stored at -80 °C until HIF-1α and NRF2 analyses were performed using Elabscience enzyme-linked immunosorbent assay (ELISA) kits (Catalog no: E-EL-H6066 for Human HIF-1α and Catalog no: E-EL-H1564 for Human NRF2). Standard curves, generated from serial dilutions and fitted with a four-parameter logistic (4-PL) model, were utilized to determine analyte concentrations (pg/mL or ng/mL), with the lower limit of quantification (LLOQ) and limit of detection (LOD) verified against the respective kit specifications. Accuracy was evaluated via spike-and-recovery assays, and the intra- and inter-plate precision—reported as coefficients of variation (CV)—consistently fell below 10%, demonstrating high reproducibility. Likewise, inter-operator, inter-site, and inter-day assessments confirmed the robustness of the assays (Table 1) (Fig. 2a and b) [19]. Furthermore, serum creatinine values were recorded for each participant, and the estimated glomerular filtration rate (eGFR) was calculated using the Chronic Kidney Disease Epidemiology Collaboration (CKD-EPI) formula [20].

The standard curves of a) HIF-1α and b) NRF2
Renal elastography
Renal shear wave elastography (SWE) was conducted on all children on the same day as blood and urine sampling by a radiologist with five years of experience in renal ultrasonography and blinded to the group assignments, using a Philips Epiq 7 unit (Koninklijke Philips N.V., The Netherlands), equipped with a convex transducer (1–6 MHz). The SWE examinations were conducted with the patient in a supine position and an empty bladder. Each kidney was divided into three sections: upper pole, middle section, and lower pole, with measurements performed separately in each section. A region of interest (ROI) measuring 3 × 3 mm was placed vertically on the cortex of each kidney section while the patient lay on their side. If possible, patients were instructed to hold their breath in slight inspiration during the measurements. The mean values of the measurements for each kidney were calculated and recorded as shear wave velocity (SWV) in meters per second (m/s) [4]. Accordingly, the maximum SWV value obtained from the right or the left kidney was taken as the basis in the patient and control groups in general (Fig. 3a and b). However, in the event of children with unilateral renal agenesis in the patient group, SWV was measured only from one kidney.

a) Shear wave elastography of a child with vesicoureteral reflux in the right kidney accompanied by a scar formation in the upper pole. b) Shear wave elastography of a child with normal findings in the left kidney accompanied by a scar formation in the middle pole
Sample size calculation
The sample size was determined using G*Power 3.1.9.6 software. Based on values from Liu’s study [17] (patient group: 16.0 ± 4.7 kPa, control group: 8.3 ± 2.4 kPa) with calculated effect size (d = 2.06), a priori power analysis indicated a minimum requirement of 8 participants per group (total 16) for 95% power at 0.05 alpha level. Accounting for 20% potential attrition, at least 10 participants per group were needed.
Our study included 44 participants per group, substantially exceeding the minimum sample size required for statistical significance detection based on high effect sizes observed in similar studies. Post-hoc power analysis for HIF-1α and NRF2 biomarkers revealed 99% power for both variables.
Statistical analysis
The study’s primary outcome was the difference in HIF-1α and NRF2 levels between the patient and control groups, and the secondary outcome was the correlation between the HIF-1α and NRF2 levels and renal elastography findings.
The results of the statistical analyses were tabulated using descriptive statistics, i.e., median with interquartile range values for continuous variables not conforming to the normal distribution and numbers and percentage values for categorical variables.
The normal distribution characteristics of the numerical variables were analyzed using appropriate tests and visual methods depending on the sample size and the characteristics of the data. Accordingly, the Shapiro-Wilk test and visual tools such as histograms and quantile-quantile (Q-Q) plots were used for comparisons involving small groups (n < 50). On the other hand, in comparing the differences in categorical variables between the groups, Pearson’s chi-square test was used for 2 × 2 tables with expected cells of 5 or more, as it provides more reliable results for larger sample sizes. Additionally, the Mann-Whitney U test was used to compare the differences in numerical variables determined not to conform to the normal distribution between two independent groups.
Spearman’s rank-order correlation analysis was used to assess the correlations between numerical variables determined not to conform to the normal distribution. Accordingly, correlations between any two variables with a Spearman’s Rho correlation coefficient (r) were considered very weak (r < 0.20), weak (0.20 ≤ r < 0.40), moderate (0.40 ≤ r < 0.60), strong (0.60 ≤ r < 0.80), and very strong (0.80 ≤ r < 1.00).
Statistical analyses of the collected data were carried out using Jamovi project 2.3.28 (Jamovi, version 2.3.28.0, 2023, retrieved from and JASP 0.19.0 (Jeffreys’ Amazing Statistics Program, version 0.19.0, 2024, retrieved from software packages. In addition to p-values, effect sizes (e.g., rank-biserial correlation) and 95% confidence intervals (CIs) were calculated where appropriate to quantify the magnitude and precision of observed differences. Probability (p) statistics of ≤ 0.05 were deemed to indicate statistical significance.
link